
How to Measure AI Automation ROI for a Small Business Team
AI automation ROI compares what a task cost before with what it costs now, automation included. You need a baseline, three numbers and a monthly review of them.
Record volume, minutes and errors before launch, price each hour at wages plus benefits, then count usage fees, review time and upkeep against hours saved.
Payback is the build cost divided by net monthly value. At a few dozen items a month, one odd week can swing the result, so judge it on full months of data.

Record a baseline before you automate
Without a record of how the work runs today, every result after launch looks like an improvement. Two to four weeks of rough numbers on the current process are enough to compare against.
What to record for two to four weeks
For the process you plan to automate, track four things:
- Volume: how many times the task happens.
- Time per task: minutes from start to finished, including corrections.
- Error rate: how often the output needs fixing or causes a problem later.
- Response time: for customer-facing work, how long people wait.
Write down who did the work as well. The hourly cost below depends on whose time is being freed, and a task split between an owner and an assistant has two different prices.
Where the baseline already lives
Some of the baseline already exists in your tools. Email timestamps show how long replies took, your CRM shows lead volume, and invoices and support tickets carry dates. Pull those records first, then time by hand only what the systems do not capture, such as minutes spent per task.
Rough numbers are enough
For example, a team that logs "about 15 minutes per lead, 40 leads a week" has a baseline; a team that guesses afterwards does not. Those two numbers already say the task takes about 10 hours a week, which is the ceiling on what an automation can save there.
Track three numbers after launch
After launch, the same log turns into three numbers: hours saved, quality against the baseline and the business outcome the process drives. Each one needs a price or a target to mean anything.
Hours saved, review included
Hours saved are the baseline time minus the current time, and the current time includes every minute someone spends reviewing or correcting the automation's work. If a reply that took 15 minutes now takes 3 minutes to check and send, the saving is 12 minutes, not 15.
Count only time that is actually freed for other work. Minutes saved in small pieces across a day may not add up to anything the business can use.
What an hour of staff time costs
Multiply hours saved by the loaded hourly cost: wages plus benefits. In the Bureau of Labor Statistics' June 2026 data, private establishments with 1 to 49 workers paid $37.64 per hour worked, against $67.68 at those with 500 or more workers.
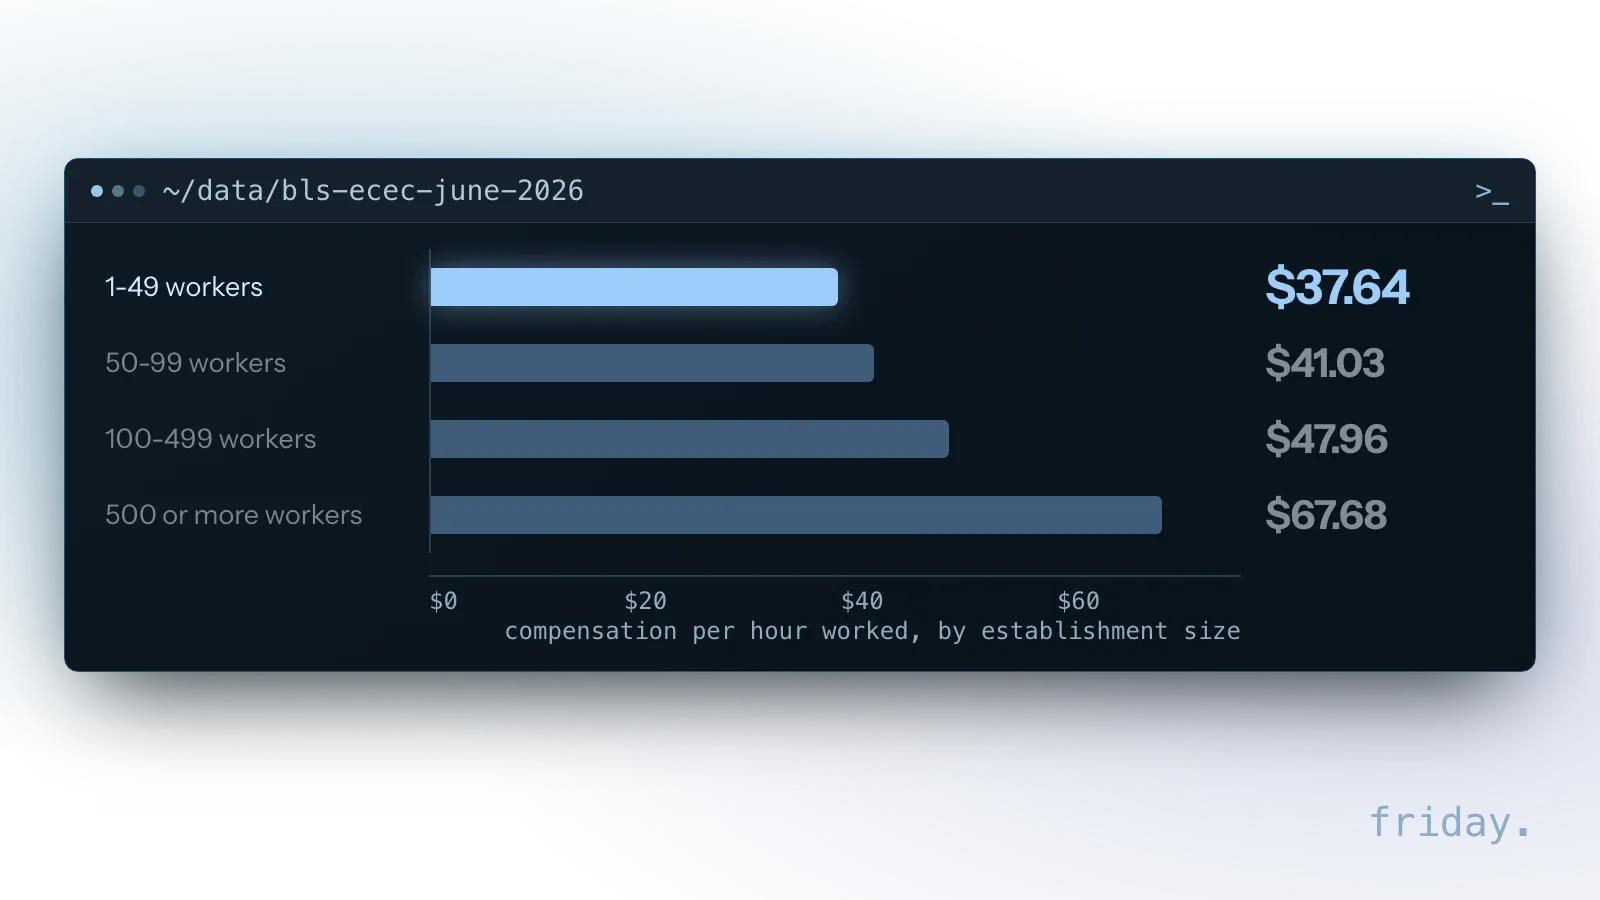
The $37.64 figure for the smallest establishments splits into $27.88 in wages and salaries and $9.76 in benefits, so benefits add 35 percent on top of pay (25.9 percent of the total). The cost rises with each larger size group, and the step up to 500 or more workers accounts for about two thirds of the whole gap. The source is Table 6 of the Employer Costs for Employee Compensation release, published September 9, 2026. The same release puts sales and office occupations in private industry at $36.34 per hour.
These are national averages. If you know your own payroll and benefit costs, use them instead; the BLS figure is a reference point when you do not.
Quality and outcome
Quality is the error or correction rate compared with the baseline. Faster but worse is no gain, because the errors come back later as rework or lost customers.
The outcome is the business result the process drives, such as leads answered within an hour, invoices collected on time or tickets resolved without escalation. Pick one outcome per workflow and keep the definition the same for the whole review period.
Count the costs people leave out
An ROI estimate with an incomplete cost side looks better than the real result. Usage fees, review minutes, maintenance and your own team's setup hours all belong on the cost line.
Usage fees that grow with volume
AI APIs bill per token, a small unit of text, with separate rates for input and output. On Anthropic's API pricing page, Claude Sonnet 5.5 costs $2 per million input tokens and $10 per million output tokens, and the Batch API halves both, to $1 and $5.
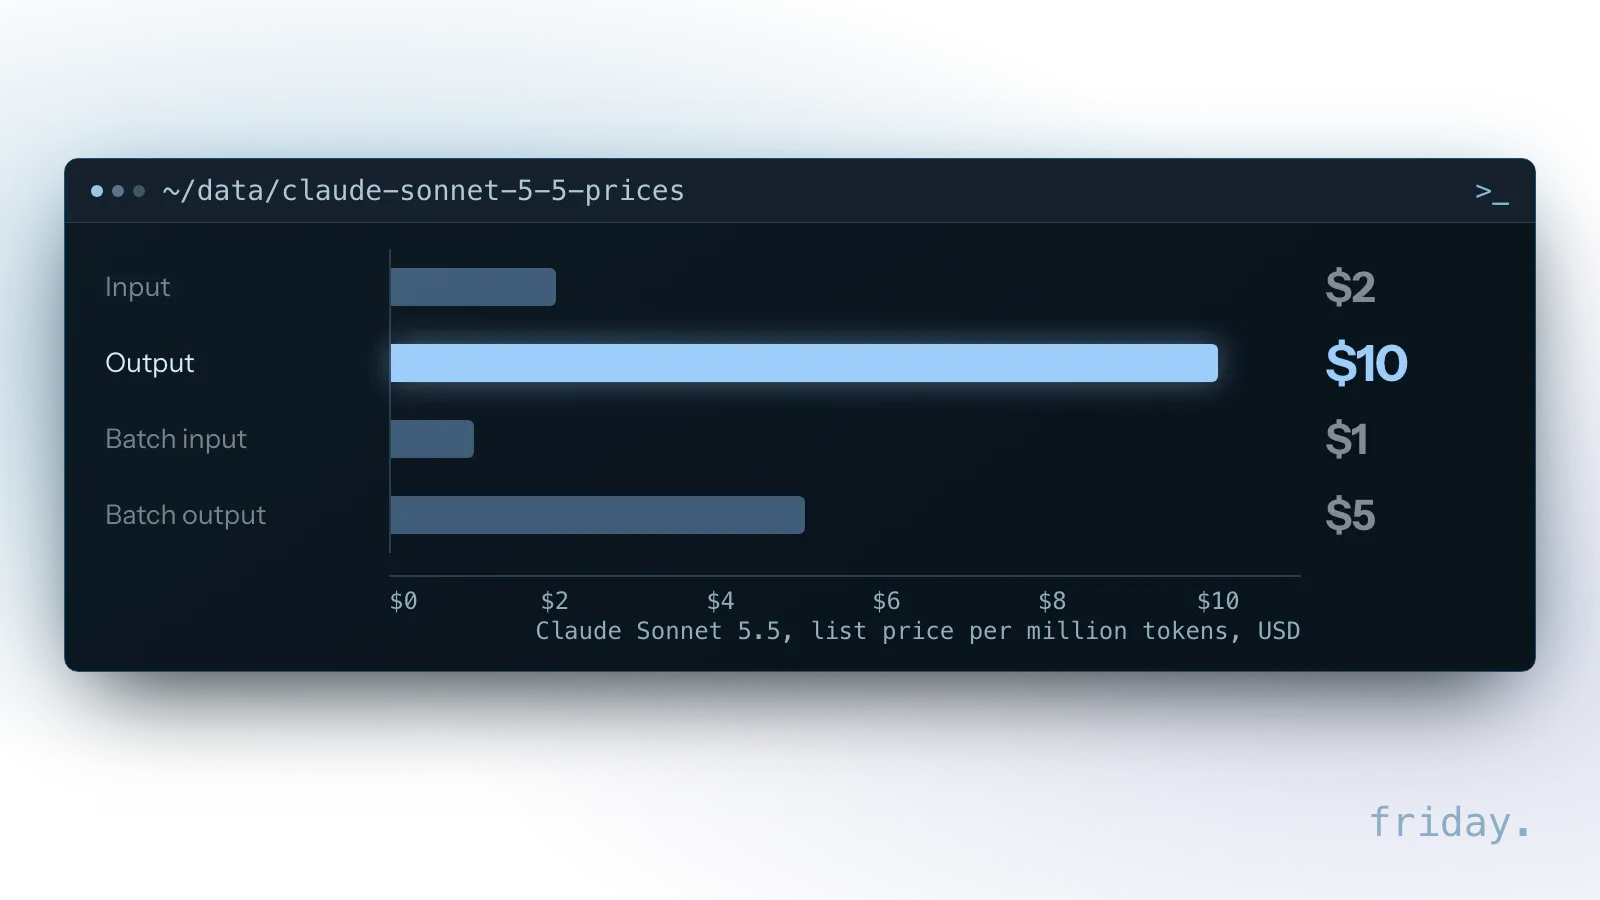
Output costs five times as much as input on that model, so long replies cost more than long questions. Long documents, long replies and retries all raise the bill, and the bill grows with every extra item the workflow handles.
Review, maintenance and setup time
- Review time. Minutes spent checking and correcting AI output belong in the new cost, even when they feel like part of the old job.
- Maintenance. Connected tools change their APIs, models are updated or retired and instructions need adjusting. Budget hours for this every month and price them at the same loaded hourly cost.
- Your team's setup time. Hours spent explaining the process, collecting examples and testing are real costs, even when no invoice arrives.
Costs you can cut by design
Work that does not need an instant answer, such as drafting overnight reports, can run through a provider's batch option. Anthropic's Message Batches API documentation says most batches finish in less than an hour, and that results are available once every request has completed or after 24 hours, whichever comes first. A lead reply that customers wait for is a poor fit; a weekly summary is a good one.
Avoid vanity metrics
Usage counts show that people use a tool, and they say nothing about whether it pays. Keep them in the log for adoption, and keep them away from the hours, quality and cost columns.
Adoption numbers in their own column
"The assistant was used 2,000 times this month" says nothing about value. Prompts sent, features enabled and active users measure adoption. Keep them in a separate column so they do not get mistaken for results.
Questions that turn usage into value
When someone reports a usage number, ask what it replaced. How many of those 2,000 uses removed a task from someone's day? How many needed a correction? The answers move the number into the hours or quality column, where it can be priced.
Calculate payback honestly
Two formulas answer the payback question: the payback period and ROI for a set period. Both depend on net monthly value, which is the value of time saved minus every running cost of the automation.
Two formulas
Payback period is the one-time build cost divided by net monthly value, where net monthly value is the value of time saved, plus any measured outcome gains, minus monthly running costs. ROI for a period is the net value over that period minus the build cost, divided by the build cost.
The payback worksheet
This worksheet turns those formulas into rows. Fill it from your baseline, and leave out any saving you cannot measure yet.
| Item | Your number |
|---|---|
| Hours saved per week | |
| Loaded hourly cost | |
| Value of time saved per month (hours × cost × 4.33) | |
| Running costs per month (software, AI usage, maintenance) | |
| Net monthly value | |
| One-time build cost | |
| Payback period (build cost ÷ net monthly value) |
A worked example
Take the baseline from the first section: 15 minutes per lead, 40 leads a week, or 10 hours. In this example, a reply workflow cuts each lead to 3 minutes of review, which saves 8 hours a week, worth $301.12 at $37.64 an hour. With $177.70 a month in running costs and a $4,000 build, payback takes about 15.4 weeks.
The $37.64 is the BLS figure for establishments with 1 to 49 workers, and the token prices are Anthropic's. The lead volume, minutes, token counts, software fee, maintenance hours and build cost are example values to replace with your own:
- Value of time saved per month: 8 hours × $37.64 × 4.33 weeks = $1,303.85.
- AI usage: about 173 leads a month, each using 4,000 input tokens and 600 output tokens on Claude Sonnet 5.5, comes to $2.42 a month at $2 and $10 per million tokens.
- Software: $100 a month for the automation platform.
- Maintenance: 2 hours a month at $37.64, or $75.28.
- Running costs: $2.42 + $100 + $75.28 = $177.70 a month.
- Net monthly value: $1,303.85 − $177.70 = $1,126.15.
- Payback: $4,000 ÷ $1,126.15 = 3.6 months, or about 15.4 weeks.
Over the first 12 months, the net value is $13,513.80, so ROI for the year is ($13,513.80 − $4,000) ÷ $4,000, about 238 percent. That result holds only if the 8 hours are really used for other work. If the freed time goes unused, the value line drops toward zero and the automation never pays back. In this example, AI usage is the smallest cost; the platform fee and maintenance hours weigh far more.
Run the same worksheet with less favorable numbers before you commit. In the same example, if review takes 6 minutes per lead instead of 3, the saving falls to 6 hours a week, net monthly value to $800.19 and payback to about 5 months. If only 4 of the 8 hours are freed for other work, net monthly value is $474.22 and payback stretches to about 8.4 months.
The build cost stays the same in every case, so the result depends on review minutes and freed hours. Those are the two numbers to measure with care in the first month after launch.
Hard savings and soft benefits
Hours saved and lower error rates are numbers you can measure and price. Other benefits are real but harder to price, and they stay out of the payback math until a measured outcome supports them.
What counts as a hard number
A hard number has a baseline, a current value and a price: hours at the loaded hourly cost, errors at the cost of fixing one, late invoices at the cash they hold up. If you cannot fill in all three, the item is a soft benefit for now.
What AI users report about their costs
In the Federal Reserve Banks' 2026 Small Business Credit Survey, 77 percent of employer firms using AI reported no change in labor costs from it, against 16 percent reporting a decrease.
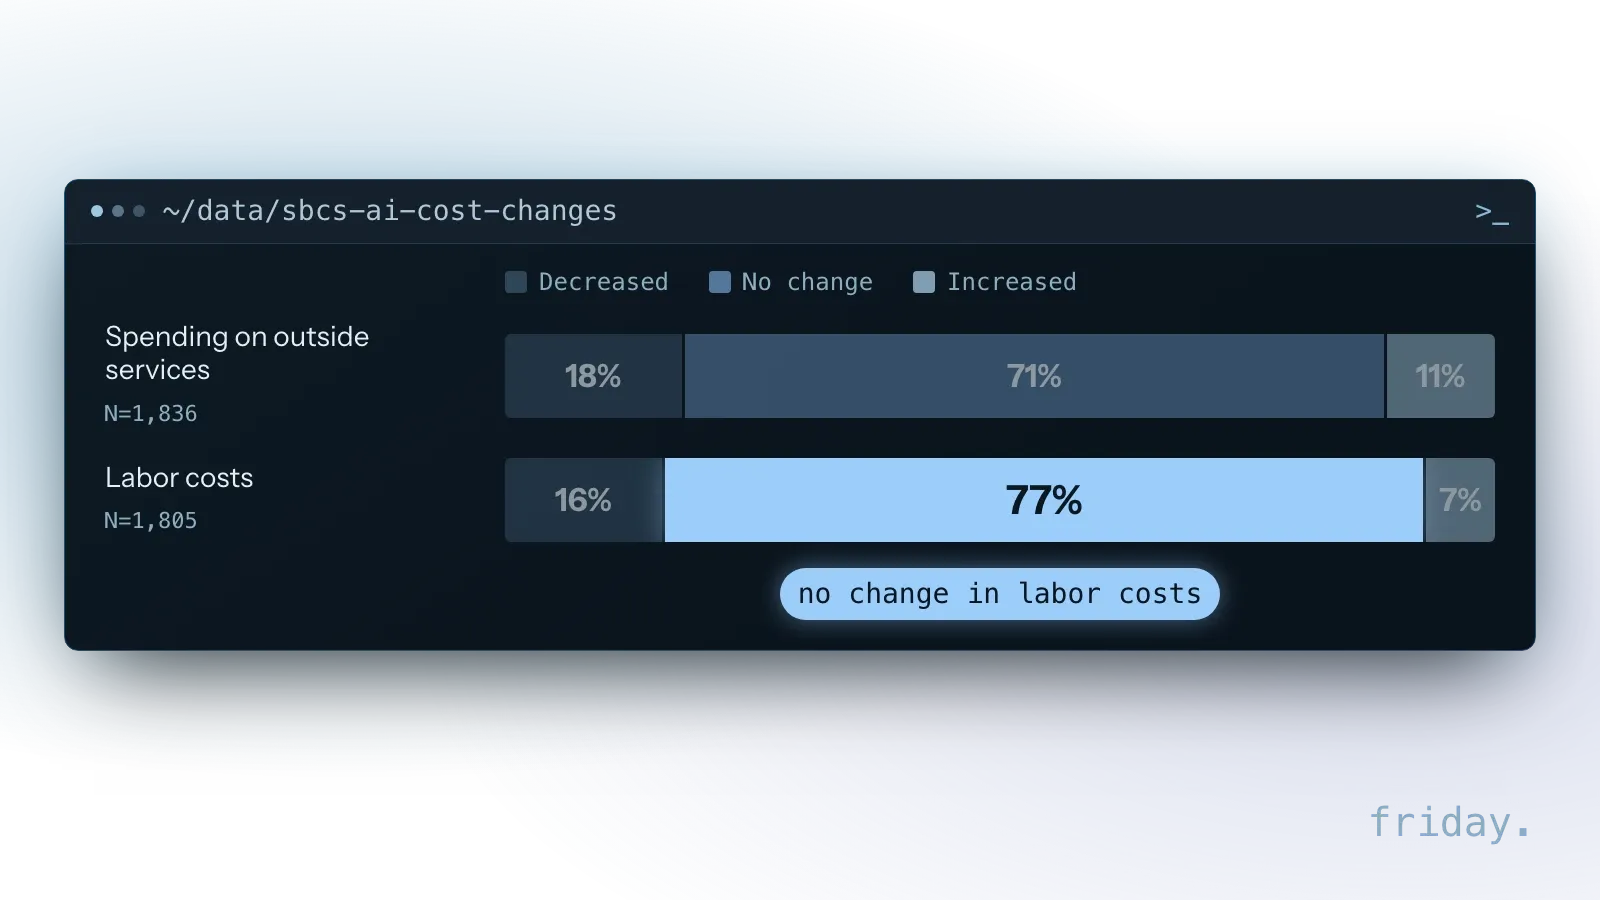
The survey drew on a nationwide convenience sample of employer firms with 1 to 499 employees, fielded from September 3 to November 14, 2025, and its AI questions were an optional module at the end. It records whether costs changed and gives no reasons.
Keep freed hours and cash savings apart in your own numbers. Hours saved carry a value at the loaded hourly cost, while a cash saving appears only when payroll, overtime or outside spending actually falls, so mark which of the two each line in the worksheet is.
When a soft benefit earns a place in the math
Customers answered after hours, fewer interruptions for senior staff and a process that no longer depends on one person being in the office are real benefits. Record them in writing, but keep them out of the payback math unless you can tie them to a measured outcome. If faster replies are supposed to win more deals, compare the conversion rate of quickly answered leads with the baseline, and count the difference only once you have enough leads to trust it.
Give it the right amount of time
Time savings can be read from the first full month of use. Revenue effects need enough volume to stand out from normal variation, so set the review date and its decision at launch.
Time savings first, revenue later
Hours saved show up as soon as the workflow runs, because the log compares minutes per task directly. Revenue effects, such as better lead conversion from faster replies, need enough leads in both the baseline and the new period to compare. At 40 leads a week, a month gives you about 173 leads; a business with a few dozen leads a month needs several months to reach the same count.
Set a review date at launch
Put the review date in the calendar on launch day, with the numbers you expect to see by then. If the numbers have not moved by that date, improve the automation or stop it. A date chosen afterwards is easy to move when the results disappoint.
Measuring at small-business volume
Small numbers move around a lot. With a few dozen items a month, one unusual week can make an automation look brilliant or useless, and three habits make the signal clearer.
Compare full months
Compare full months with full months, and compare with the same period in the baseline where your business is seasonal. A December baseline says little about a slow February.
Change one thing at a time
If you launch the automation and a new pricing page in the same month, you cannot tell which one moved the numbers. Hold other changes to the same process until the first review date has passed.
Sample quality by hand
Pull a fixed number of outputs each month and score them against the same checklist you used for the baseline. The same sample size every month keeps one bad batch from looking like a trend.
FAQs About Measuring AI Automation ROI
No single ROI figure counts as good; the test is payback within the period you set at launch. Without a baseline, rebuild one from records, and give each workflow its own numbers.
What is a good ROI for AI automation?
There is no standard figure. A practical test is whether the automation pays back its build cost within the period you set at launch and keeps saving time after. Treat published ROI figures that come without a stated baseline and cost list with caution.
What if we did not record a baseline?
Reconstruct it as well as you can from logs, emails or a week of manual tracking on the old process. A rough baseline beats none.
Who should own the numbers?
The person responsible for the process. The builder of the automation has an interest in a good result, so a second person keeps the review honest.
Should we measure ROI per workflow or for all our AI use?
Per workflow first. Each automation should justify its own cost; a combined total can hide one that loses money behind another that saves a lot.
Measure before you build
A baseline recorded before launch, a loaded hourly cost from your payroll or the BLS, a full cost line and a review date are what turn an automation into a number you can check.
That is also where our work starts: on a free first call we look at how long your processes take today and which ones are worth automating first. Every workflow we build starts by mapping the process with the people who run it. Tell us which process you want to measure, and we will help you set up the baseline.
Last checked: November 16, 2026, against the BLS Employer Costs for Employee Compensation release for June 2026 (summary and Tables 4 and 6), Anthropic's API pricing page, the Message Batches API documentation and the Federal Reserve Banks' 2026 Report on Employer Firms. Prices and wage data change; check the linked pages before relying on a figure.
Wage, price and survey figures come from the BLS, Anthropic and the Federal Reserve Banks, checked November 16, 2026.